
CaixaBank | How will the Spanish economy be affected by the performance of its main export markets?
In this article we investigate how the ups and downs of our main trading partners’ economies can affect the Spanish economy through the trade channel. To this end, we developed a synthetic indicator that summarises the foreign demand for Spanish goods and services, and below we assess its predictive capacity and analyse the expected trends in the short and medium term.
What are the main export markets?
In the historical average, 66% of Spanish exports, of both goods and services, have gone to 15 countries or regions: the euro area, the United Kingdom, the US, Turkey, Mexico, Morocco, Brazil, Sweden, Japan, Switzerland, Poland, China, the Czech Republic, Norway and Denmark (1).This selection thus captures a large portion of our sales abroad, although the percentage has fallen slightly in the last three years as a result of the export sector’s efforts to diversify the recipient markets (see first chart).
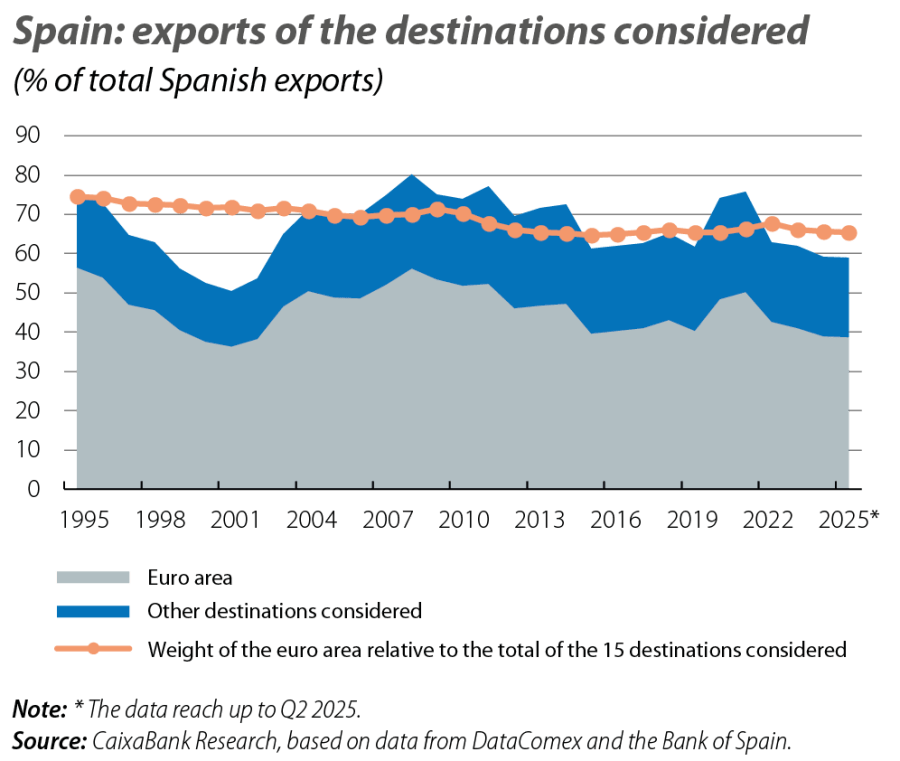
Despite its decreasing relative weight over time, the euro area remains by far the main destination for exports: on average, between 1995 and 2019, euro area countries absorbed 46.4% of foreign sales, and in 2023-2024 that share fell to 39.7%.
A thermometer of foreign demand for Spain
With these 15 key markets, we built a Spanish «export markets» indicator. To do this, we combined the growth of imports (in volume) of each of these destinations, weighted according to the portion of total Spanish exports that each destination country represents each year. Although this is a very simple indicator, it follows a very similar pattern to that of Spanish exports of goods and services (see second chart).
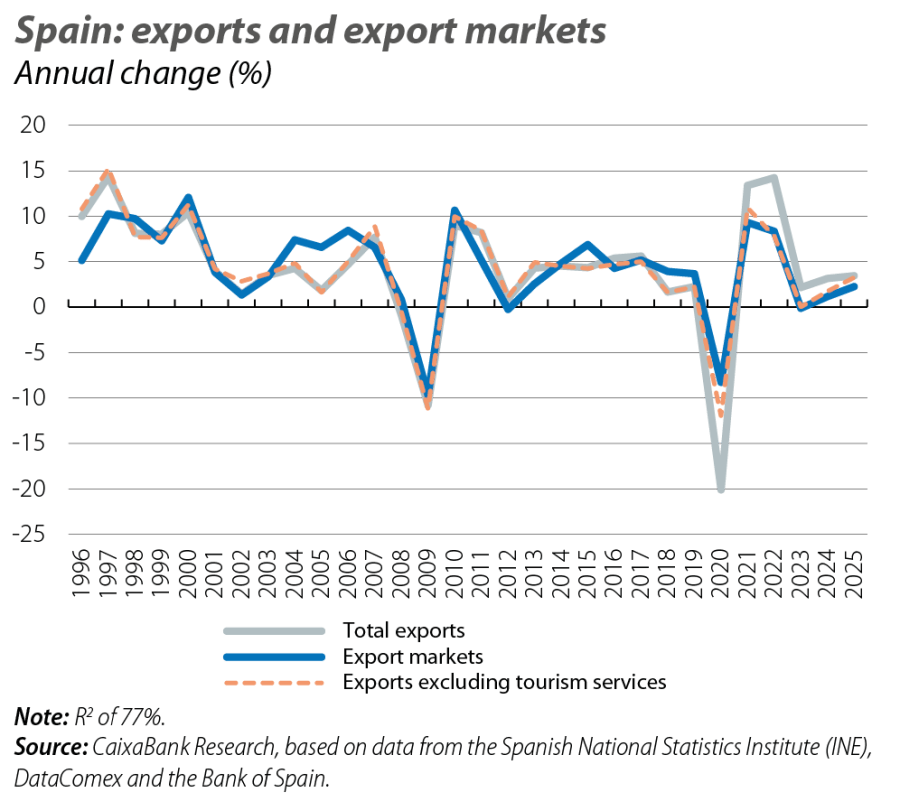
There is a very close relationship between these two series: when demand from our export markets accelerates, Spanish sales abroad tend to pick up, and vice versa. This relationship is very clear between 1997 and 2019, and of particularly note is the strong relationship between the two variables during the financial crisis from 2007 to 2010. Since 2020, with the outbreak of the pandemic, the relationship has persisted – the indicator closely follows the evolution of exports, although the link is less close. In particular, in the last four years, the indicator has tended to underestimate the evolution of Spanish exports. This probably stems from the sharp fall experienced in 2020 and the subsequent recovery in exports of tourism services. Indeed, when we compare the evolution of our indicator with that of total exports, excluding tourism exports (see the dashed line in the second chart), we see that the gap disappears. While our synthetic indicator is built using the total imports of our main export markets, including tourism imports, it may be the case that in the last four years Spain has gained market share in the tourism sector and this could explain the gap between our indicator and the evolution of total exports. When we take the entire sample together, the elasticity of the growth of Spanish exports to the growth in demand from the export markets is 1.2: if the imports of our trading partners grow by 1% more, we would expect the growth of Spanish exports to increase by 1.2 points.
If we consider the proportion of GDP that is attributable to exports (around 37%) and the import content of exports, we find that 1 point more growth in our export markets results in a 0.2-pp increase in GDP growth (2). What happens in our main foreign markets has a direct and considerable impact on exports and, therefore, on the growth of the Spanish economy.
Outlook for 2025-2027
To carry out the forecasting exercise, we relied on the International Monetary Fund (IMF) forecasts published in the October 2025 World Economic Outlook, which provides projections for the growth of imports for each of the 15 destinations that make up the synthetic foreign demand indicator (see third chart).
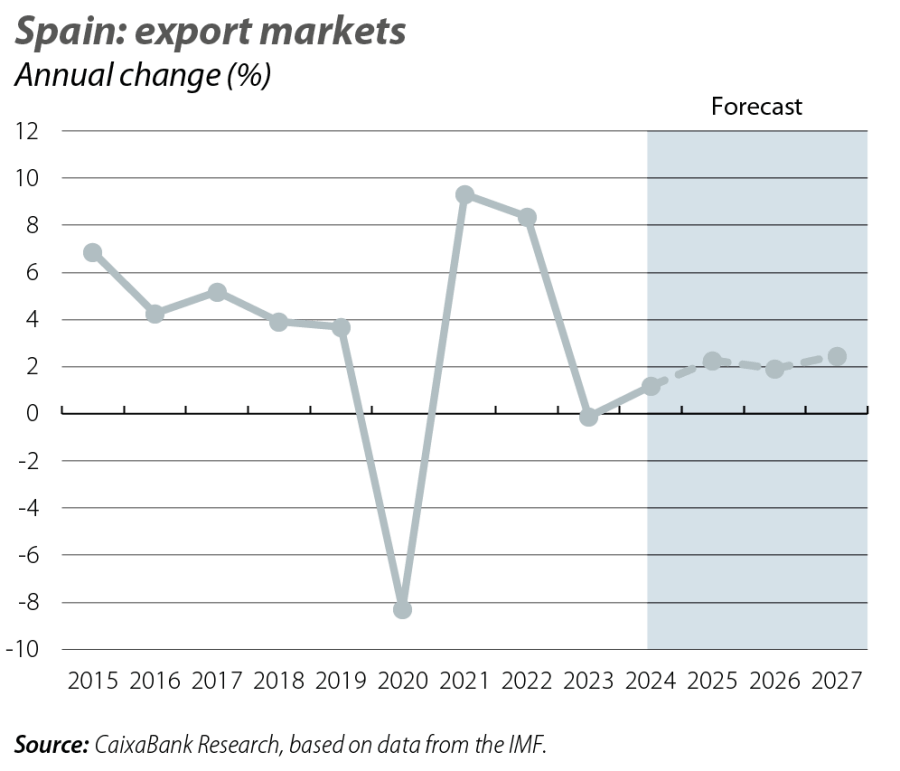
The resulting numbers suggest modest growth in the export markets, albeit better than that recorded in 2023-2024: the Spanish export market is expected to grow by 2.3% in 2025, with the growth rate remaining at around 2% in 2026 and 2027. This exceeds the growth rate of 0.6% per year recorded in 2023-2024, although it would be substantially below the average growth rate for the period 2015-2019, of 4.8%.
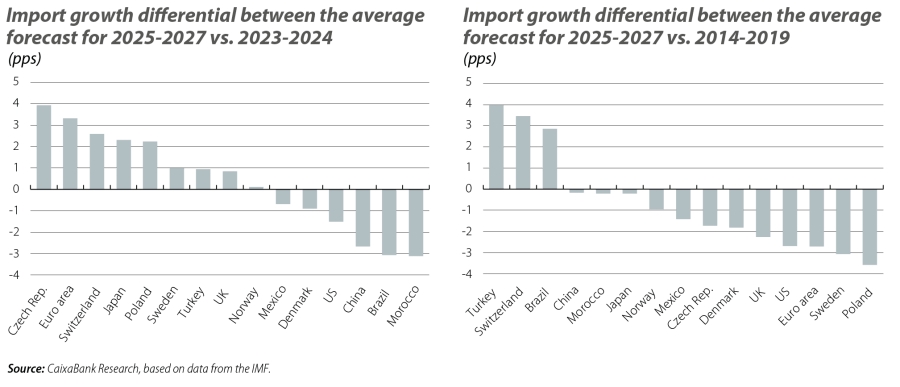
This pattern indicates that, after a challenging 2023 and 2024, largely affected by the impact that the energy crisis and the cycle of interest rate hikes had on the euro area, our exporters are benefiting from a slight improvement in global demand. As can be seen in the left-hand panel of the fourth chart, according to the IMF’s forecasts the improvement is linked to the recovery of imports in countries within the European continent. This is not the case for the US and China, which are expected to perform worse than in 2023-2024, likely affected by the protectionist shift of the US and the sharp hike in tariffs between the two powers. However, the improvement in the performance of the export markets will be limited, as we would not return to the growth rates of the pre-pandemic period. This pattern is fairly widespread among the various export markets (see the right-hand panel in the fourth chart), except for Turkey, Brazil and Switzerland, and may reflect the stagnation – or even a slight setback – of the globalisation process, as well as the EU’s weak growth environment.
Notes
(1) To do this, we use data on exports of goods from DataComex going back to 1995, and data on exports of services from the Bank of Spain covering the period since 2013. With this data, we created two lists: one with the top 10 destinations for exports of goods in each period, and the other with the top 10 destinations for exports of services. Then, we selected all the countries that appear in one of the two lists. Many appear in both lists, but some only appear in one. In those cases, we excluded countries that were only in one list and which, moreover, have not been in the top 10 in the last three years in either list. In addition,
we excluded Russia due to problems accessing data.
(2) We assume an import content of 39%, in line with the estimate made by A. Cabrero and M. Tiana (2012). «The import content of the industrial sectors in Spain». Economic Bulletin. Bank of Spain.
ti potrebbe interessare
LE STORIE #1
Alicia è nata a Granada, ha vissuto per 5 anni a Barcellona ma risiede da 12 anni a Milano. Le sue più grandi passioni sono la cucina e la fotografia che le consentono di evadere e...
Neon affianca CompuGroup Medical per la strategia di comunicazione, il naming e la corporate identity di MARE Technopark, il nuovo hub internazionale dell’e‑health
L’agenzia creativa indipendente Neon è stata scelta da CGM - CompuGroup Medical quale partner di consulenza strategica di comunicazione per l’intero percorso di costruzione e...
The Week I Love
Scalo Milano Outlet & More, l’unico outlet a 15 minuti dal centro di Milano ti aspetta da lunedì 23 a domenica 29 maggio, solo i possessori della Scalo Milano I Love Card avranno...